System-independent.
No vendor lock-in. Works on your existing contact centre and on your other sources.
Effecta Connect: Dashboards Core product
See queues, service levels and staffing as it happens, not in tomorrow’s report. For wallboards on the floor, management screens and agents. Works on Avaya, Cisco, Genesys, Mitel and more.
From practice
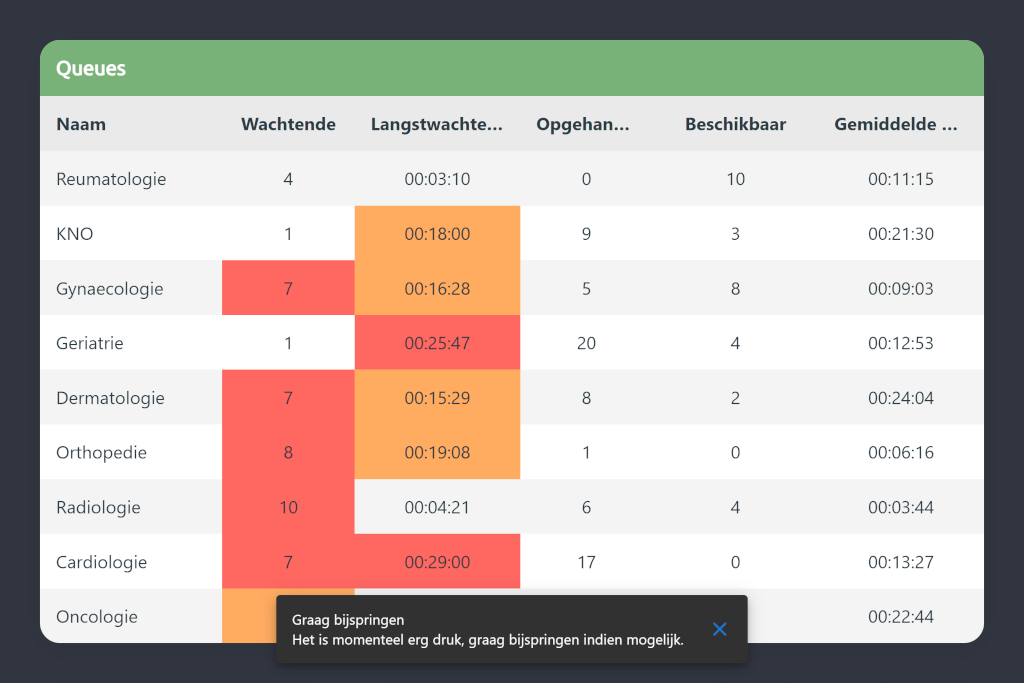
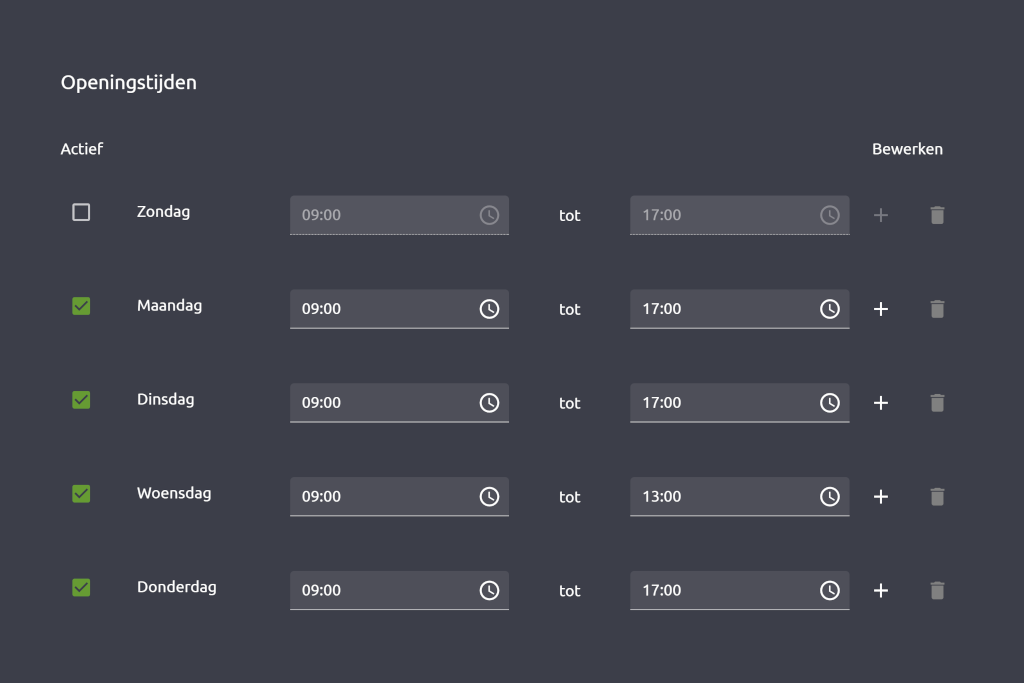
Two screens from a live environment: queues per department with colour codes and a push notification as soon as a threshold is exceeded, and the opening hours per day that you set yourself.
Benefits
No vendor lock-in. Works on your existing contact centre and on your other sources.
Manager, team leader, agent, executive board: everyone sees what matters to them.
Drag, resize and move widgets. Changes are visible straight away.
Set thresholds. If the waiting time rises, the screen changes colour and you get a push notification.
Colour indicators show at a glance whether a department is open, about to close or closed. You see peaks coming.
Add a widget to ten dashboards in a few clicks.
Anyone can manage dashboards, widgets, filters and alerts themselves, without technical knowledge.
Trends over weeks and months, alongside the real-time view. For reporting and adjusting course.
For the floor, for the manager, for the agent
Wallboard
Everyone sees the same reality: how many are waiting, for how long, who is available.
Management screen
With history for the weekly report. Trends over weeks and months alongside the real-time view, as an add-on.
Agent Dashboard Add-on
Agents see peaks coming and deal with them before the queue fills up.
More about Agent DashboardMore than figures
Sharing successes, showing birthdays, making a team goal visible. It sounds small, it works big. Teams that see their results feel seen. And home workers see the same screen as colleagues in the office.

Works with
View all integrationsPricing model
Whether three or three hundred people are watching, the price stays the same. A dashboard with different data for a different department counts as a new dashboard. That keeps it clear and affordable.
Request a price indicationProof of Concept
A live dashboard on real data, answers to your questions.
On your KPIs, in your branding. IT only approves the integration.
Together we evaluate what it delivers.
Against the contract. No double costs.
Does IT first want to know how it connects and what is stored? Send them to For IT: integrations, security and system requirements.
Copy link for ITMore about Dashboards
A contact centre dashboard is only useful if it answers the question the team leader has at that moment: do I need to step in now? Three figures are usually enough for that: how many people are waiting, how long the longest has been waiting and how many agents are available. Everything around that, such as service level over the day, staffing per skill and opening hours, provides context. A screen with forty numbers does not provide context, but noise.
That is why the first step at Effecta is not the technology, but the question of which KPIs matter for each role. The agent works to the queue and their own calls. The team leader to service level and staffing. The manager to trends per location and per week. Each of those roles gets its own layout, with the same data as the source. That way nobody sees figures they cannot act on.
A call centre wallboard hangs in the department and has to be readable from five metres away. Large figures, little text, colour only when something is wrong. Green means nobody needs to look. Orange and red draw attention. That is deliberate: a wallboard that always shouts is ignored after a week. Want to see what that looks like for your team? Request a Proof of Concept, or read on first in the knowledge base.